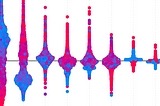
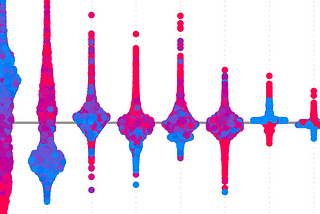
PinnedConor O'SullivaninTowards Data ScienceIntroduction to SHAP with PythonHow to create and interpret SHAP plots: waterfall, force, mean SHAP, beeswarm and dependenceDec 19, 202111Dec 19, 202111
PinnedConor O'SullivaninTowards Data Science7 Lessons from an ML Internship at IntelAutomation, machine learning and LLMs in the chip industryFeb 1210Feb 1210
PinnedConor O'SullivaninTowards Data ScienceWhat is Explainable AI (XAI)?An introduction to XAI— the field aimed at making machine learning models understandable to humansSep 19, 20221Sep 19, 20221
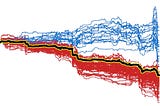
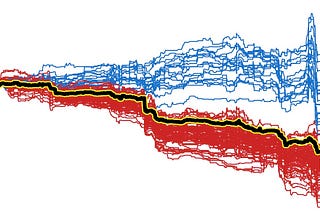
PinnedConor O'SullivaninTowards Data ScienceThe Ultimate Guide to PDPs and ICE PlotsThe intuition, maths and code (R and Python) behind partial dependence plots and individual conditional expectation plotsJun 28, 20221Jun 28, 20221
PinnedConor O'SullivaninTowards Data ScienceAnalysing Fairness in Machine LearningDoing an exploratory fairness analysis and measuring fairness using equal opportunity, equalized odds and disparate impactApr 29, 20221Apr 29, 20221
Conor O'SullivaninTowards Data ScienceA Deep Dive on LIME for Local InterpretationsThe intuition, theory, and code for Local Interpretable Model-agnostic Explanations (LIME)Jun 26Jun 26
Conor O'SullivaninTowards Data ScienceAnalysing Interactions with Friedman’s H-stat and PythonApplying the H-stat with the artemis package and interpreting the pairwise, overall, and unnormalised metricsJun 21Jun 21
Conor O'SullivaninTowards Data ScienceUnderstanding Friedman’s H-statistic (H-stat) for InteractionsThe intuition and maths for the H-stat used to find interactions in machine learning modelsMay 28May 28
Conor O'SullivaninTowards Data ScienceDeep Dive on Accumulated Local Effect Plots (ALEs) with PythonIntuition, algorithm and code for using ALEs to explain machine learning modelsMay 20May 20
Conor O'SullivaninTowards Data ScienceCrafting Time Series GIFs of Satellite Images with PythonWitness the evolution of our world with 40 years of Landsat data and minimal manual workMay 122May 122